Now that we have overcome the technical difficulties hurdle of MAP Testing, your students may have remembered to write down their scores when they finished the test. If you are looking for some guidance on how to interpret the range of scores, NWEA has some great resources.
Your students should have encountered some questions beyond their current understanding of the subject. This is typical of adaptive testing, which starts the students with level-appropriate questions, then depending on the speed and accuracy of their answers, increases or decreases the difficulties of subsequent questions.
Students will be given a RIT score at the end of the test. “RIT stands for Rasch UnIT, which is a measurement scale developed to simplify the interpretation of test scores. RIT scores range from about 100 to 300. Students typically start at the 180 to 200 level in the third grade and progress to the 220 to 260 level by high school”(NWEA, 2019). RIT is grade independent, which helps parents compare a student’s growth continuously throughout their K-12 education. If my 8th grader has the same math RIT score as my 10th grader, it means they are comparable in their math capabilities at the testing point. However, if a 2nd grader has the same RIT score as a 7th grader, it doesn’t mean the 2nd grader is at the same level of the 7th grader, because they took two different sets of MAP tests.
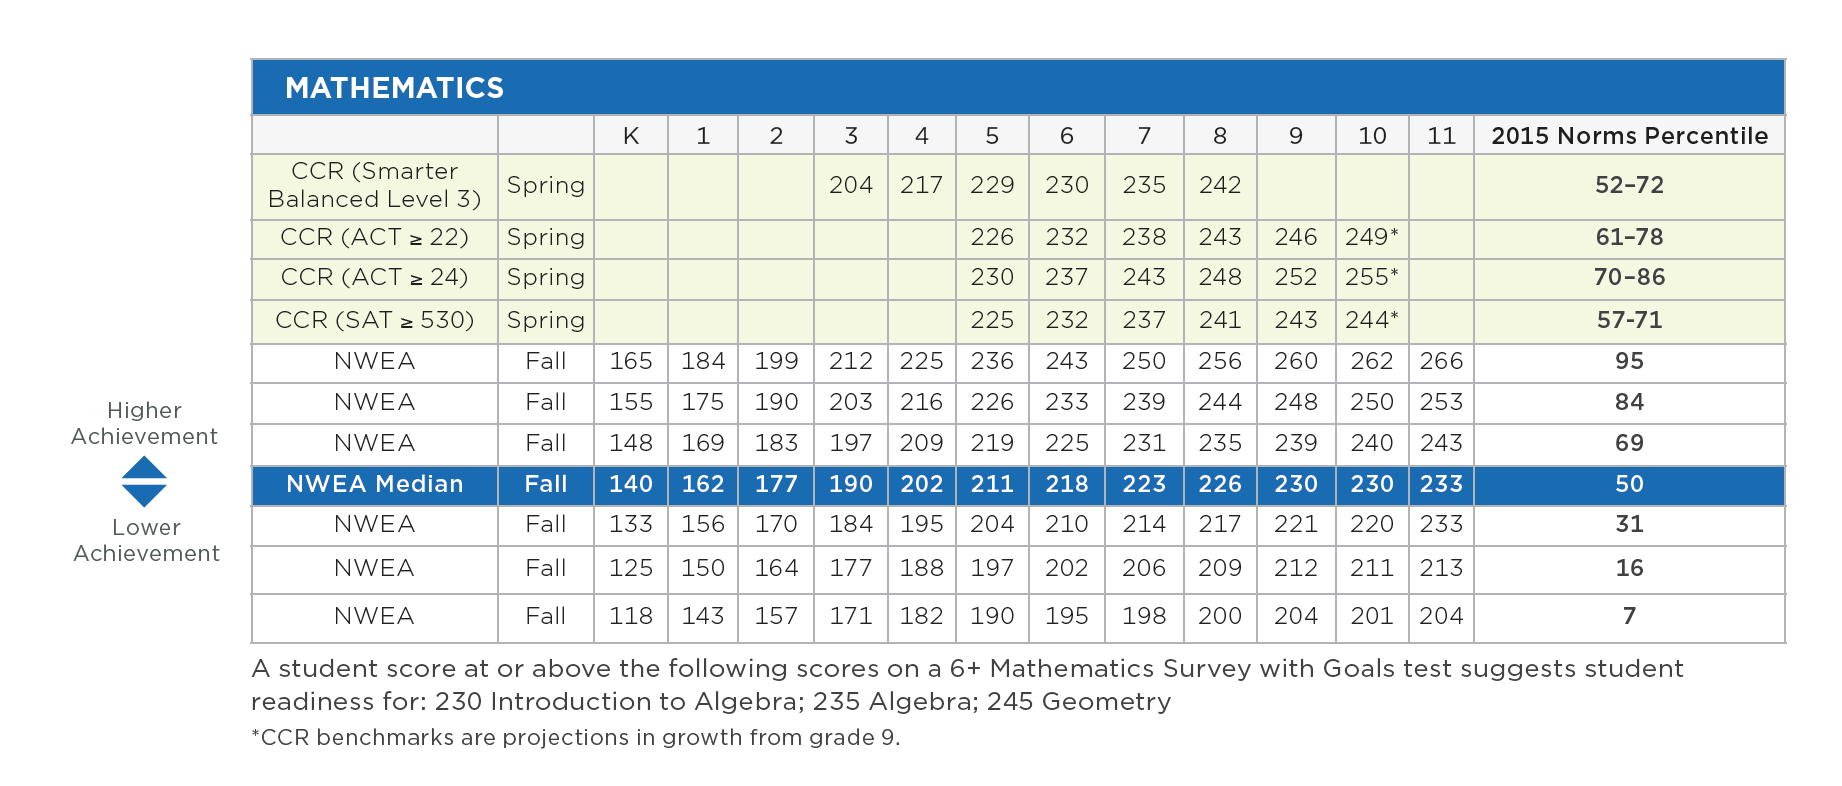
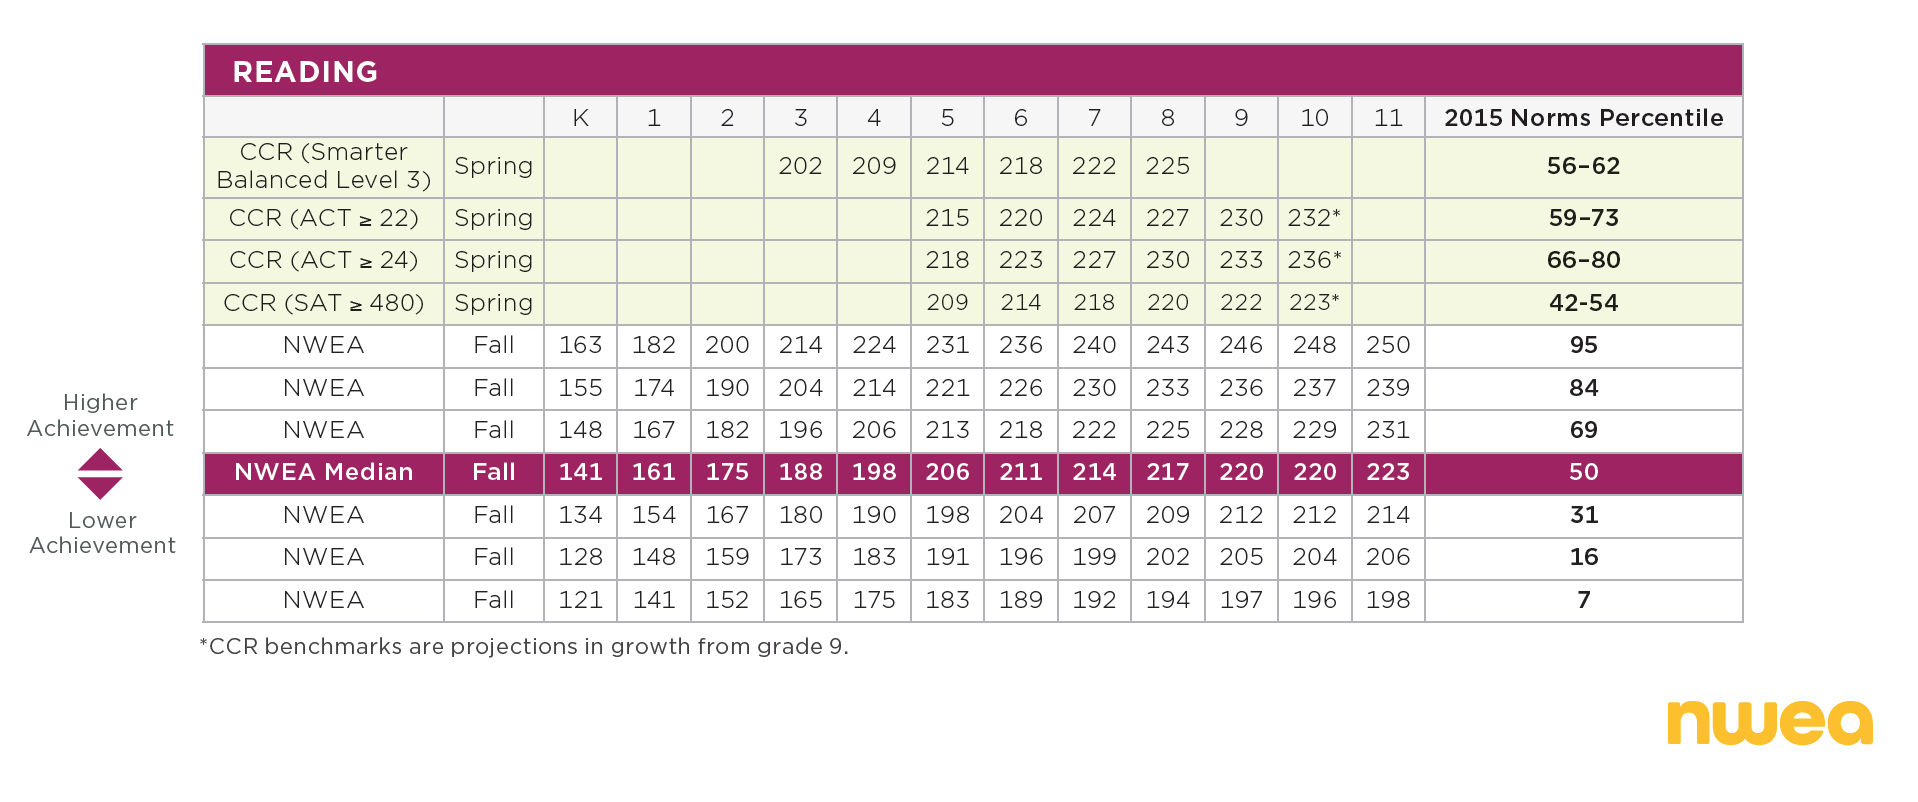
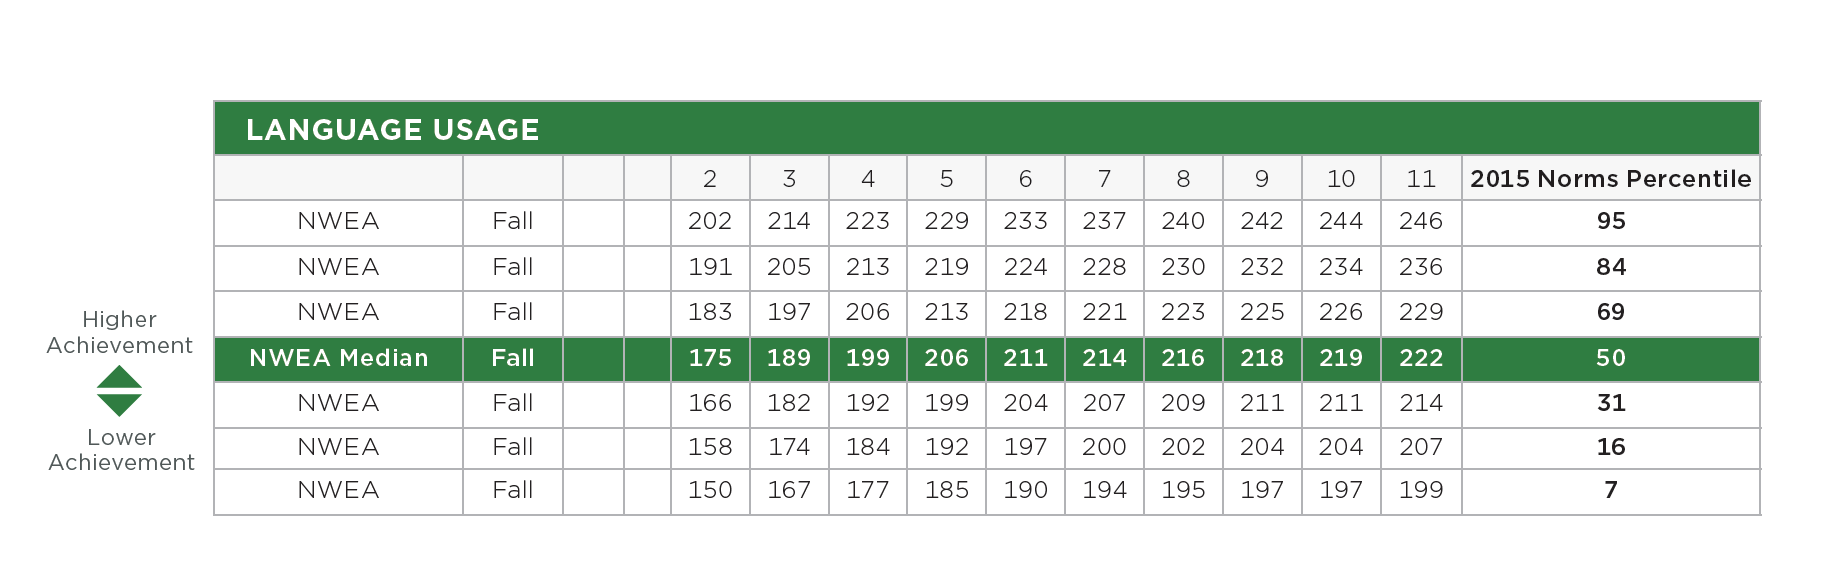
NWEA has a report explaining the percentiles and grade comparison of RIT scores based on 2015 data. I attached some charts from the report (NWEA, 2015)
Math
Reading
Language
Remember this test is one of many your child will be taking throughout this year and beyond. You will receive a more detailed report of each areas they have been tested on.
Have fun reading the charts!

